App Dashboard Widgets
App Dashboard Widgets is a section in the mobile app builder tool. It allows you to configure the dashboards and widgets that are displayed at the top of the screen in the mobile app. The tutorial will help you set up the graphs and summary blocks.
We will be setting up an app called Demo App based out of the "Punch" module. I will be recreating an app that has already been created in the Mobile App Builder tool. To see that, and for an overview of the entire Mobile App Builder tool, click here.
Keep in mind, while working in this tool, it may be necessary to save and refresh the page often.
Creating a Graph/Widget.
In the App Dashboard Widgets section, there are lines for 3 graphics and 4 summary blocks. It is helpful to remember that the number displayed in each of these widgets is a count. Graph 1 will display the total number of "New Punches." It can, however, link to a report of all "New Punches," that will show up under the widgets.
- First, fill out the name of the graph. Here, we named the first one "New Punches Demo."
- Next, we will create the report. This is the report that will generate the count of New Punches. Click Create Report. This will open a new tab.
- The new tab will be the report editor.
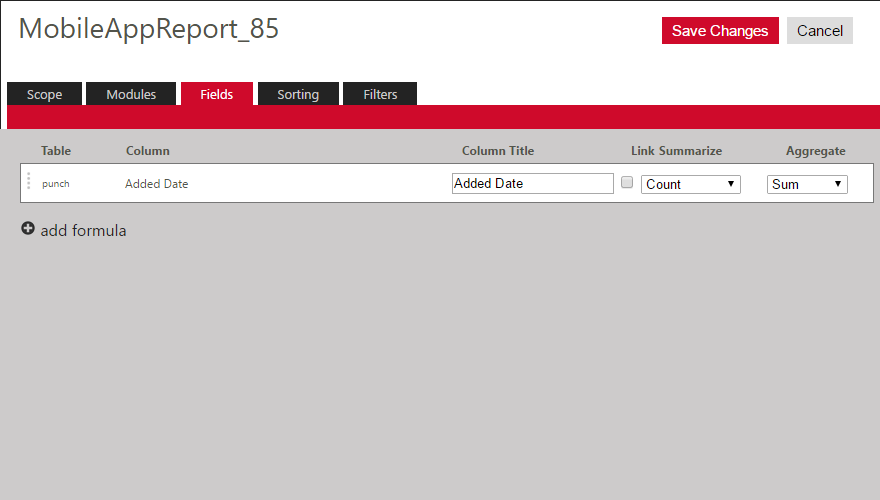
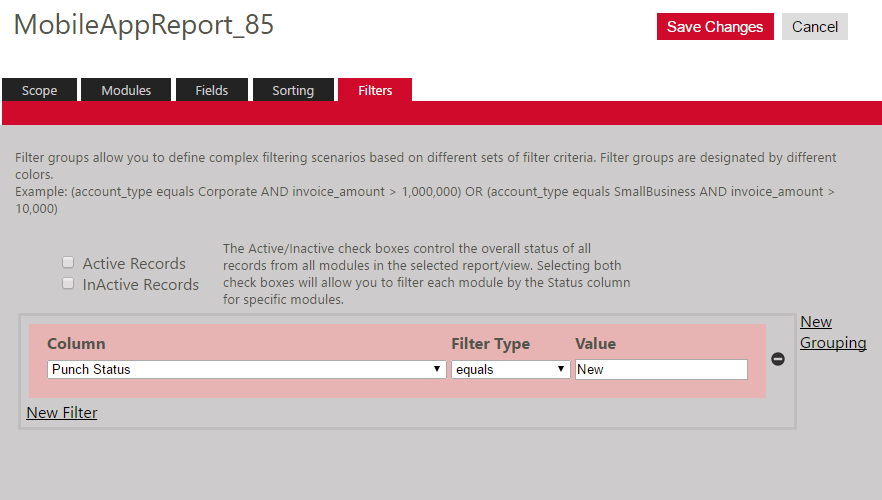
Under Scope you will select Unassigned and Everything I Can See. Under Modules, you will select Added Date. (Every record created has an added date. Therefore will can count the number of added dates from records that meet a certain criteria. This will give us our count). Under Fields, you will select Count in the Summarize Drop Down, and Sum in the Aggregate drop down. You don't need to do anything under Sorting. Under Filters, we will filter all active records that have a Punch Status that equals "New."
Click Save Changes. Close out of the tab.
- Once back at the Mobile App Builder Tab, click save and refresh the page. In the Summary Field drop down, select Added Date.
We will have to leave the, "Report Link" drop down alone until we create some reports to link to. Click here for a guide on how to create the appropriate reports.
If you have created the reports, select them from the drop down menu. In the app, which you select the graph/widget, this report linked here will appear below.
- You can set the Graph Threshold at this point. Put in whatever number seems appropriate.
- Next, we will need to follow the same steps to name and create reports for the remaining graphs and summary blocks.
Now you're ready to create the reports that the graphs and widgets will link to. Click here.